Analysis and Visualisation of Protein Secondary Structure Annotations
Jalview has a number of specialised capabilities for working
with protein secondary structure annotation linked to aligned sequences.
When one or more sequences with secondary structure annotations
are present on the alignment, Jalview automatically displays
Secondary Structure Consensus annotation tracks, to
assess the proportion of Helix, Sheet or Coil annotations for
aligned positions in each column. Conensus tracks can also be shown
for particular sources of structural data (e.g. from jnet, the PDB,
AlphaFold or SWISS-MODEL), and are calculated over all the secondary
structure tracks for a sequence, allowing visualisation of diversity
across multi-chain structures that contain more than one copy of
the sequence.
Like with sequence consensus and
conservation tracks, it is also
possible shade a group of sequences or the whole alignment to highlight
regions of secondary structure conservation and divergence
with Secondary Structure
Consensus colouring.
Visualising the secondary structure consensus
To view secondary structure consensus rows, you should first
enable the Secondary Structure checkbox in
Jalview
Preferences. Once this option is checked, a consensus row will
be shown if two or more secondary structure annotations are available for
sequences in the alignment. Moving the mouse over the label of a consensus
row displays a tooltip that reports both the number of sequences, and the
number of secondary structure annotations that were included in the
consensus calculation.
The secondary structure consensus can be shown as a histogram,
reflecting the proportion of the most frequent conformation observed
in a column, optionally overlaid with a logo to reflect the
distribution of observed structure. These settings can be adjusted
by right-clicking the Secondary Structure Consensus' label to
open it's annotation track popup menu.
The Alignment window's
Annotations→Autocalculated Annotation includes
options for controlling the appearance of the secondary structure
consensus row, and whether rows should be shown for groups defined
on the alignment.
Sources of secondary structure data
Sequences can have several different secondary structure
annotations, including those provided by
observed or computationally
determined 3D structures, or predicted by
JPred. Sequence associated
secondary structure annotations can also be imported as
Jalview Annotation
files. Secondary structure annotations for a particular source can
be shown or hidden via Annotations→Show Secondary
Structure menu option in the alignment window. If there is just one source present,
Jalview will automatically hide the overall Secondary Structure Consensus track
to avoid duplication (since 2.11.5.1).
Consensus Secondary Structure
Calculating trees to visualise secondary structure similarity
Protein secondary structure tends to be more conserved than sequence,
and Jalview allows calculation of trees based on secondary structure
annotation to visualise which secondary structure tracks (and thus,
which sequences) are more structurally similar. The leaves in secondary
structure trees are linked to both a sequence and one of its secondary
structure annotation tracks, allowing secondary structures and aligned
sequences to be partitioned into groups. Secondary structure diversity
can be visualised for each group by application of
Secondary Structure Consensus Colouring.
Visualisation of differences between sources of secondary structure data
Visualisations of secondary structure trees can be labelled or shaded
according to provider (i.e. the source of secondary structure annotation), by
enabling one of the options
in Show Secondary Structure Providers.
Groups defined by partitioning trees are also labeled by provider.
The screenshot below shows an alignment grouped by secondary structure similarity and
coloured by 'Sequence ID colour'. Secondary Structure Consensus shading has also been
enabled, highlighting regions where secondary structure is not conserved.
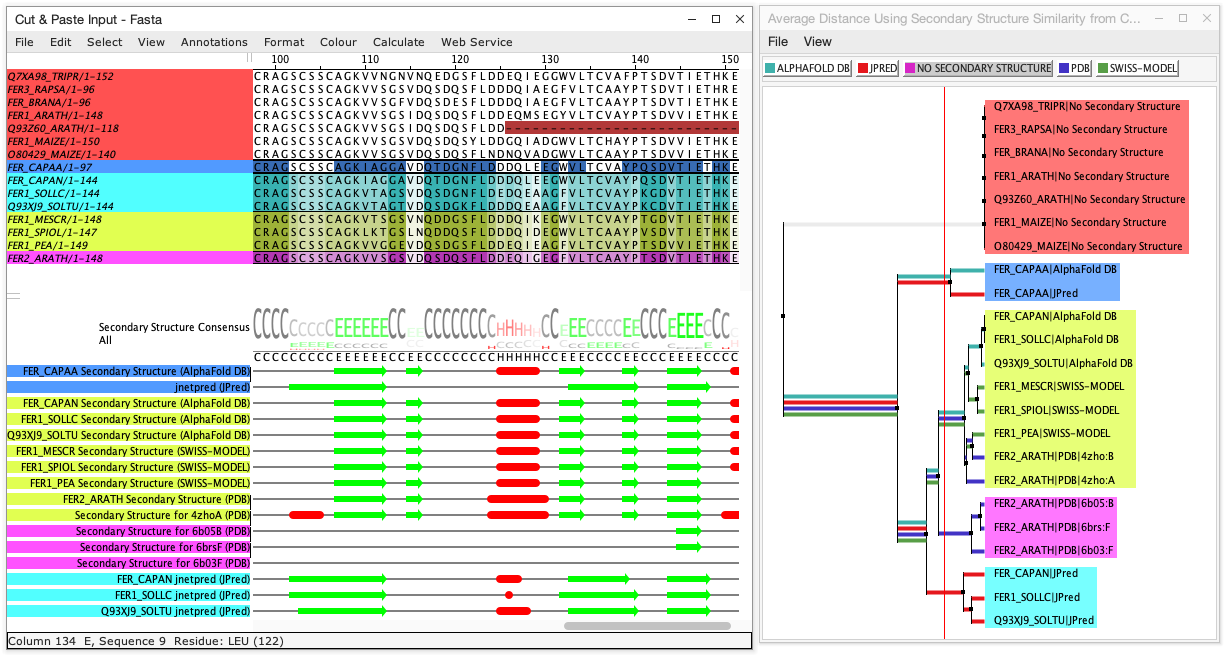
The tree also shows coloured lines corresponding to provider, visualising how the
secondary structures from each source differs from others.